
 75Likes
 LinkBack URL
 About LinkBacks
Another piece to consider would be handloading equipment quality and consistency of process. It's another area of diminishing returns and mysterious voodoo, as you get the pareto 80 with a cheap press, mass market dies, and thrown charges.Originally Posted by earplay

Welcome guest, is this your first visit? Create Account now to join.
Welcome to the NZ Hunting and Shooting Forums.
Search Forums


User Tag List
Results 1 to 15 of 70
Thread: Variables affecting precision
Threaded View
-
16-07-2025, 06:51 PM #15By Popular Demand


- Join Date
- Dec 2011
- Location
- The Big H
- Posts
- 10,891
earplay likes this.


 Reply With Quote
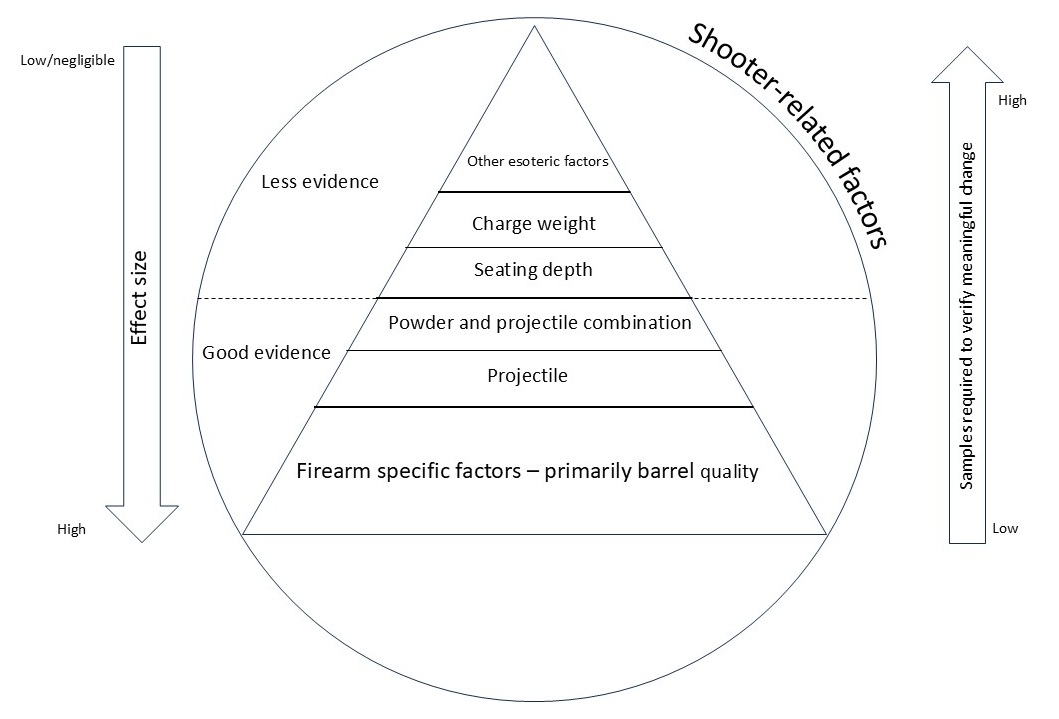
Similar Threads
-
Old Ammo Affecting Rifle Accuracy?
By Copelli in forum Firearms, Optics and AccessoriesReplies: 7Last Post: 11-05-2024, 12:31 AM -
WTB: 7mm rem mag Precision die set
By Hubt.nz in forum Reloading and BallisticsReplies: 0Last Post: 10-05-2020, 08:53 AM -
Bipod affecting accuracy.
By Finnwolf in forum Reloading and BallisticsReplies: 33Last Post: 24-08-2019, 05:33 PM -
Shooter variables
By Cartman in forum ShootingReplies: 16Last Post: 14-11-2015, 09:57 PM
Tags for this Thread
 Posting Permissions
- You may not post new threads
- You may not post replies
- You may not post attachments
- You may not edit your posts
Welcome to NZ Hunting and Shooting Forums! We see you're new here, or arn't logged in. Create an account, and Login for full access including our FREE BUY and SELL section Register NOW!!
All times are GMT +13. The time now is 11:23 PM.

Bookmarks